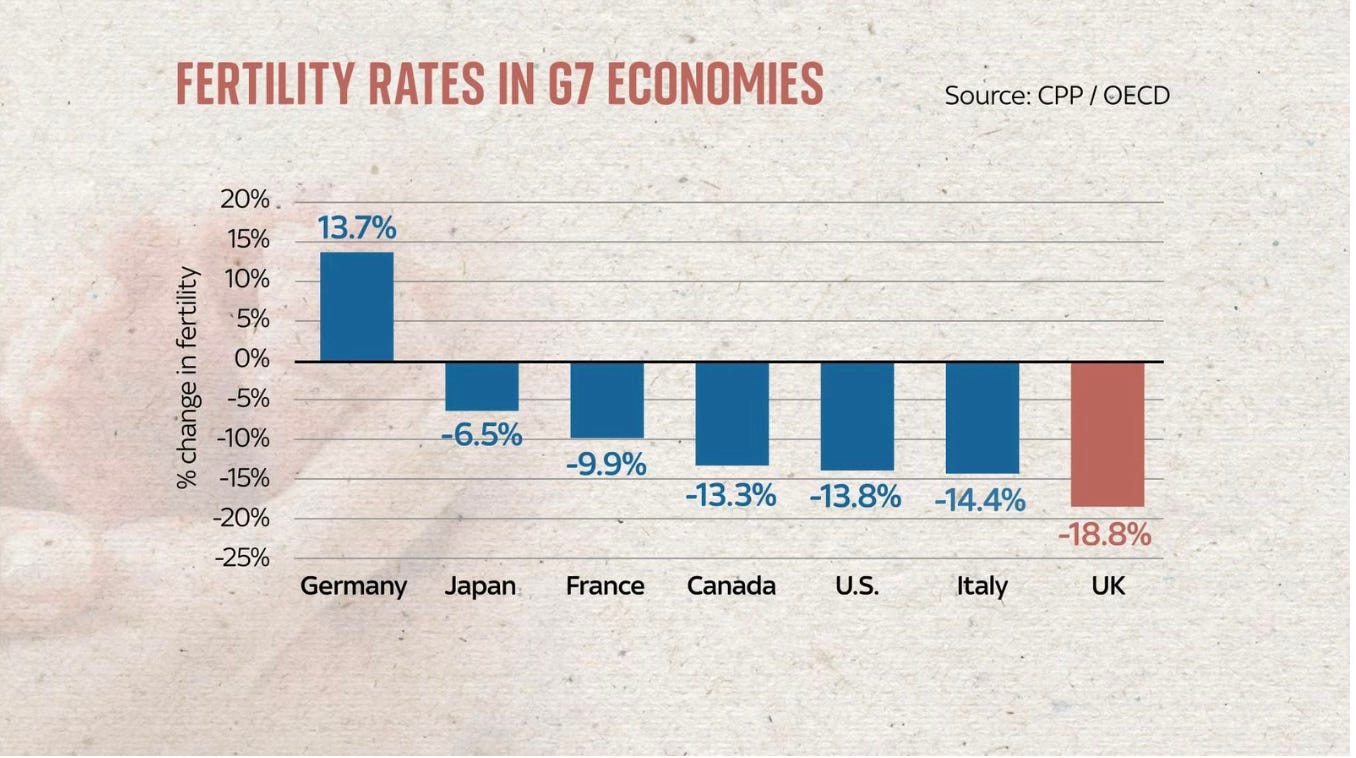
It’s only when you start to reflect on the detail of the above graph that the full demographic horror emerges. Why? Well, when you look at the basis for population replacement, you start with the fertility rate.
What does the fertility rate actually mean?
The total fertility rate (TFR) of a population is the average number of children that are born to a woman over her lifetime. We also need to understand that the Replacement-level fertility is Total fertility levels of about 2.1 children per woman.
The West Fertility Rate is way below 2.1 and the total UK TFR is way below replacement level.
The advent of contraception and rising living standards in the late 60’s-early 70’s saw it drop BELOW replacement level for the first time in our history and it has stayed there ever since. 2021 saw it hit around 1.5 children per woman. So we are not replacing ourselves.
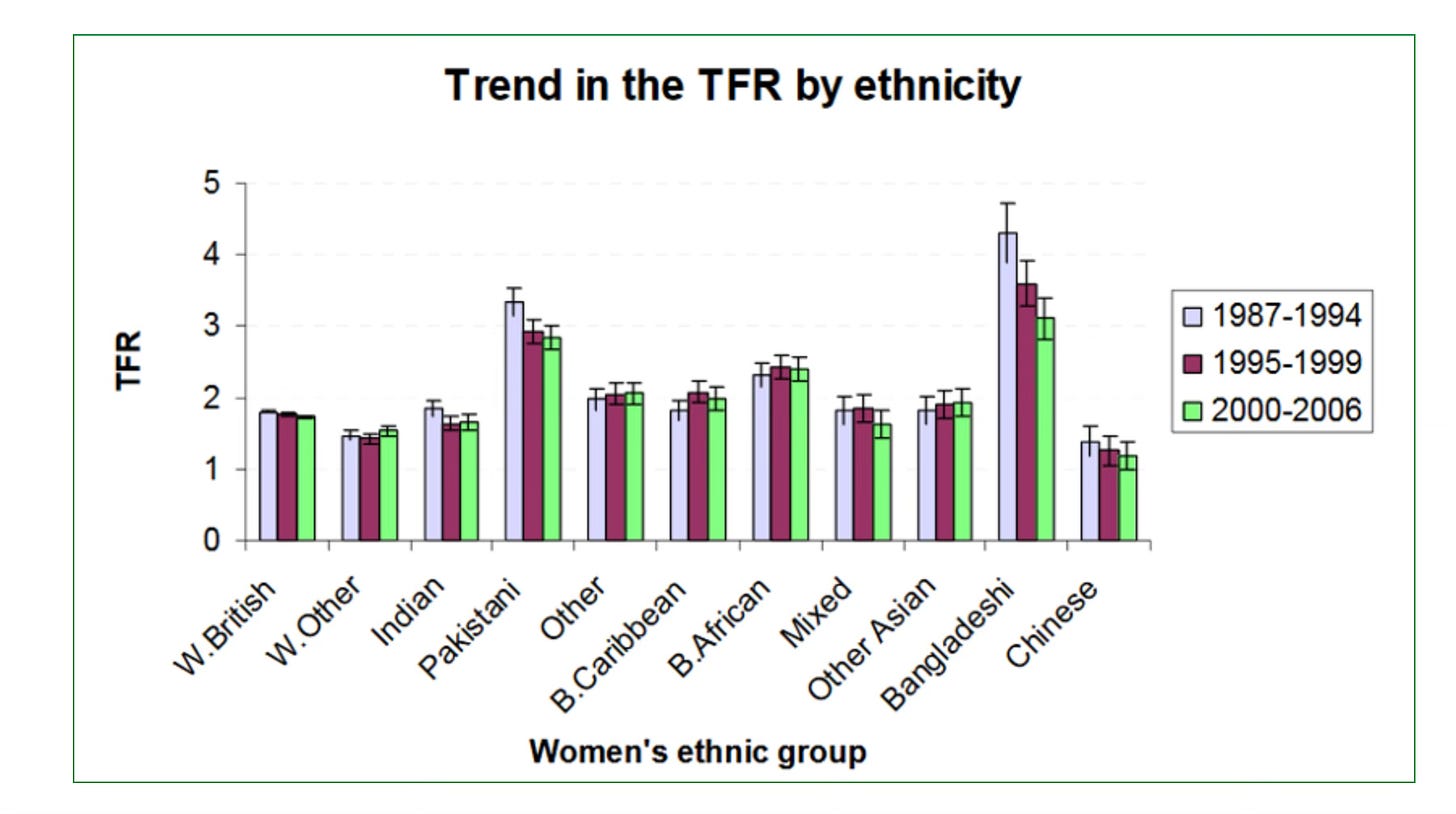
But when we examine this topic by ethnicity we see the more accurate picture emerges.
This information is now a bit outdated and the situation will be much worse nowadays but you can see the Pakistani and Bangladeshi fertility levels were MUCH higher than White British. That is likely to be similar today so we can safely conclude that the White British population is collapsing and my suggestion is that this is be design.
Our entire population growth is driven by migration in one form or another and this is evident when we realise that London has several boroughs which are minority White. Take Newham, for example.
This is likely the trajectory for the rest of England unless we start having more children. Demography is destiny.


Wisdom is justified of all her children - Luke 7